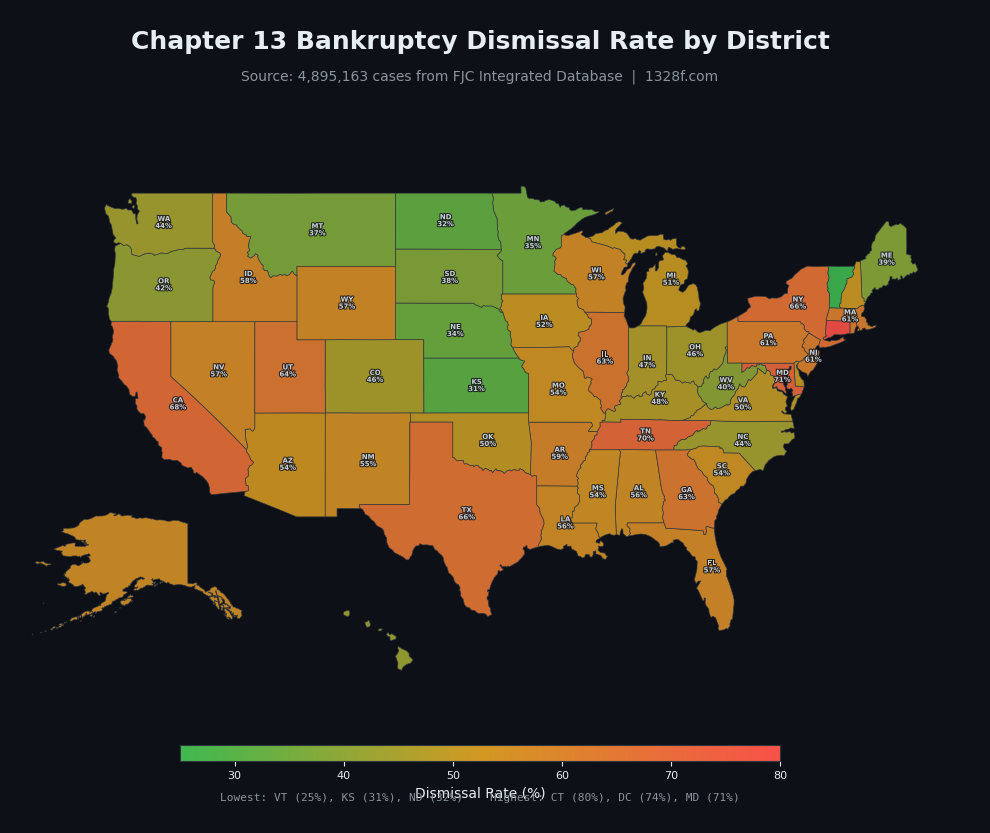
Chapter 13 Success Rate by State
The national Chapter 13 success rate is approximately 52%, but varies dramatically by district -- from 54% in the Western District of Tennessee to 97% in the District of Massachusetts. Bankruptcy outcomes depend on your federal judicial district, not your state, because court culture, trustee practices, and attorney quality differ across all 94 districts.
The remaining ~48% are dismissed before completion. This means nearly half of all people who file Chapter 13 bankruptcy do not receive the debt relief they were seeking.
Why "by State" Is Misleading
When people search for the Chapter 13 success rate in their state, what they actually need is their federal judicial district. The United States is divided into 94 judicial districts, and bankruptcy courts operate at the district level, not the state level.
This matters because states with multiple districts often have dramatically different outcomes. For example, a person filing Chapter 13 in the Eastern District of Missouri (St. Louis area) faces a different success rate than someone filing in the Western District of Missouri (Kansas City area) -- even though both are in the same state.
The table below shows success rates by district, sorted from highest to lowest.
Chapter 13 Success Rates by District
| District | Cases | Success Rate | Failure Rate |
|---|---|---|---|
| D. Massachusetts | 1,441 | 96.7% | 3.3% |
| E.D. New York | 1,087 | 95.4% | 4.6% |
| N.D. Ohio | 4,214 | 93.0% | 7.0% |
| C.D. California | 5,938 | 91.1% | 8.9% |
| S.D. Indiana | 1,419 | 90.1% | 9.9% |
| E.D. Missouri | 4,526 | 88.4% | 11.6% |
| D. Kansas | 41,718 | 87.4% | 12.6% |
| W.D. Missouri | 42,275 | 82.3% | 17.7% |
| D. New Jersey | 1,647 | 81.7% | 18.3% |
| N.D. Illinois | 7,390 | 80.5% | 19.5% |
| E.D. Wisconsin | 1,520 | 78.9% | 21.1% |
| M.D. Florida | 5,699 | 78.2% | 21.8% |
| S.D. Florida | 43,932 | 74.4% | 25.6% |
| S.D. Texas | 30,412 | 65.4% | 34.6% |
| W.D. Tennessee | 1,306 | 54.4% | 45.6% |
Source: Public PACER data. Cases screened across all 94 federal judicial districts. The table above shows a representative sample -- view the full interactive dashboard for all districts.
The interactive dashboard covers all 94 federal judicial districts with sortable columns, searchable data, and downloadable results.
Open the Dashboard
The Highest Success Rate Districts
D. Massachusetts: 96.7% -- Out of 1,441 cases screened, only 3.3% ended in dismissal. The Eastern District of New York (95.4%), Northern District of Ohio (93.0%), and Central District of California (91.1%) also show success rates well above the national average.
Districts with high success rates tend to share several characteristics:
- Rigorous feasibility screening -- Plans are more carefully reviewed before confirmation, filtering out cases that are unlikely to succeed
- Active trustee engagement -- Trustees work with debtors to address problems during the plan rather than immediately moving to dismiss
- Experienced practitioners -- Higher barriers to entry mean attorneys handling cases tend to have more specialized experience
- Lower caseloads per attorney -- Attorneys carry manageable caseloads that allow for individualized attention
The Lowest Success Rate Districts
W.D. Tennessee: 54.4% -- Nearly half of all Chapter 13 cases end in dismissal. The Southern District of Texas (65.4%) and Southern District of Florida (74.4%) also fall well below the national average.
Districts with low success rates often share different characteristics:
- High-volume filing practices -- Some districts have practitioners filing hundreds or thousands of cases annually, which can reduce the attention given to each case
- Less rigorous confirmation standards -- Plans may be confirmed more quickly with less scrutiny of feasibility
- Bare petition filing patterns -- Cases are filed with minimal documentation, with missing schedules and plans added later (or never)
- Structural economic factors -- Lower median incomes, less stable employment, and higher cost of living relative to wages
Same State, Different Outcomes
Missouri illustrates why "by state" data is incomplete. The Eastern District of Missouri (St. Louis) has an 88.4% success rate, while the Western District of Missouri (Kansas City) has an 82.3% success rate. Same state law, same bankruptcy code, but a 6-point gap in outcomes.
This pattern repeats across the country. Florida has three districts with success rates ranging from 74.4% (Southern) to 78.2% (Middle). Texas ranges from 65.4% (Southern) to rates in the 80s in other districts. The district you file in matters more than the state you live in.
What Predicts Chapter 13 Success?
Research and data analysis point to several factors that correlate with whether a Chapter 13 case will reach discharge:
Plan feasibility at filing
Cases filed with complete schedules, accurate income projections, and realistic expense estimates are significantly more likely to succeed. Cases filed as "bare petitions" -- with only the petition and no supporting documents -- have much higher dismissal rates.
Attorney experience and caseload
The attorney handling the case is one of the strongest predictors of outcome. Attorneys with manageable caseloads and specialized bankruptcy experience tend to achieve higher discharge rates. Extremely high-volume practices -- those filing hundreds of cases per year -- tend to have higher dismissal rates, often because they cannot provide individualized attention to each case.
District confirmation standards
Districts that require more thorough feasibility analysis before confirming a plan tend to have higher success rates. While this may create more work upfront, it filters out plans that were unlikely to succeed, saving debtors from years of payments followed by dismissal.
Post-confirmation support
Whether the debtor has access to support after confirmation -- from their attorney, the trustee, or community resources -- affects whether they can navigate the 3-5 year plan period successfully. Life changes (job loss, medical emergencies, divorce) are common during this period.
A high success rate does not automatically mean a district is "better." Some districts may have lower filing volumes because attorneys screen clients more carefully before filing, while others may accept more borderline cases, lowering the overall rate but serving more people. The data shows outcomes, not intent.
How to Check Your District
If you are considering Chapter 13 bankruptcy, the most useful number is not your state's average -- it is your specific district's success rate and, ideally, the track record of the attorney you are considering hiring.
- Find your district -- Use the interactive dashboard to look up your federal judicial district
- Check district-level data -- See the discharge rate, dismissal rate, and case volume for your district
- Browse state pages -- Visit the state-by-state breakdown for additional detail on your jurisdiction
- Research your attorney -- PACER (pacer.uscourts.gov) is the public system where all federal bankruptcy filings are recorded. You can look up any attorney's case history.
The dashboard includes all 94 federal districts with sortable success rates, case volumes, and dismissal patterns.
View All Districts
Additional Resources
- Dismissed vs. Discharged -- What the difference means for your case
- Chapter 13 Overview -- How the repayment plan process works
- Before You File -- What to know before starting a bankruptcy case
- Chapter 13 Dismissal Rates Report -- Detailed research on dismissal patterns and contributing factors
- U.S. Courts -- Bankruptcy -- Official federal court bankruptcy resources
- 11 U.S.C. Chapter 13 -- Full text of the Chapter 13 statute
This site is free and open-source. Donations support the Open Bankruptcy Project, a 501(c)(3) nonprofit, funding PACER access fees and bankruptcy court transparency research.
Stay updated on new datasets and research findings
No spam. No marketing. Just data.